Let AI Supercharge
Your Fundraise.
The only platform that takes you from LP discovery to signed commitment. Built by fund managers who use it for our own raises.
The only platform covering all 8 stages
Most tools cover 2-3 stages. We cover the full funnel.
From first search to final close
Step 01
Find the right LPs
Search 150K+ LP profiles by check size, sector, and geography. AI ranks matches by fit-build a list in minutes.
- 50K+ verified contacts
- Mandate matching
- AI fit scoring
Step 02
Reach out and engage
Launch AI-powered cold email sequences. Share your data room securely-AI answers LP questions 24/7.
- AI cold email
- 24/7 AI concierge
- 10 hrs saved weekly
Step 03
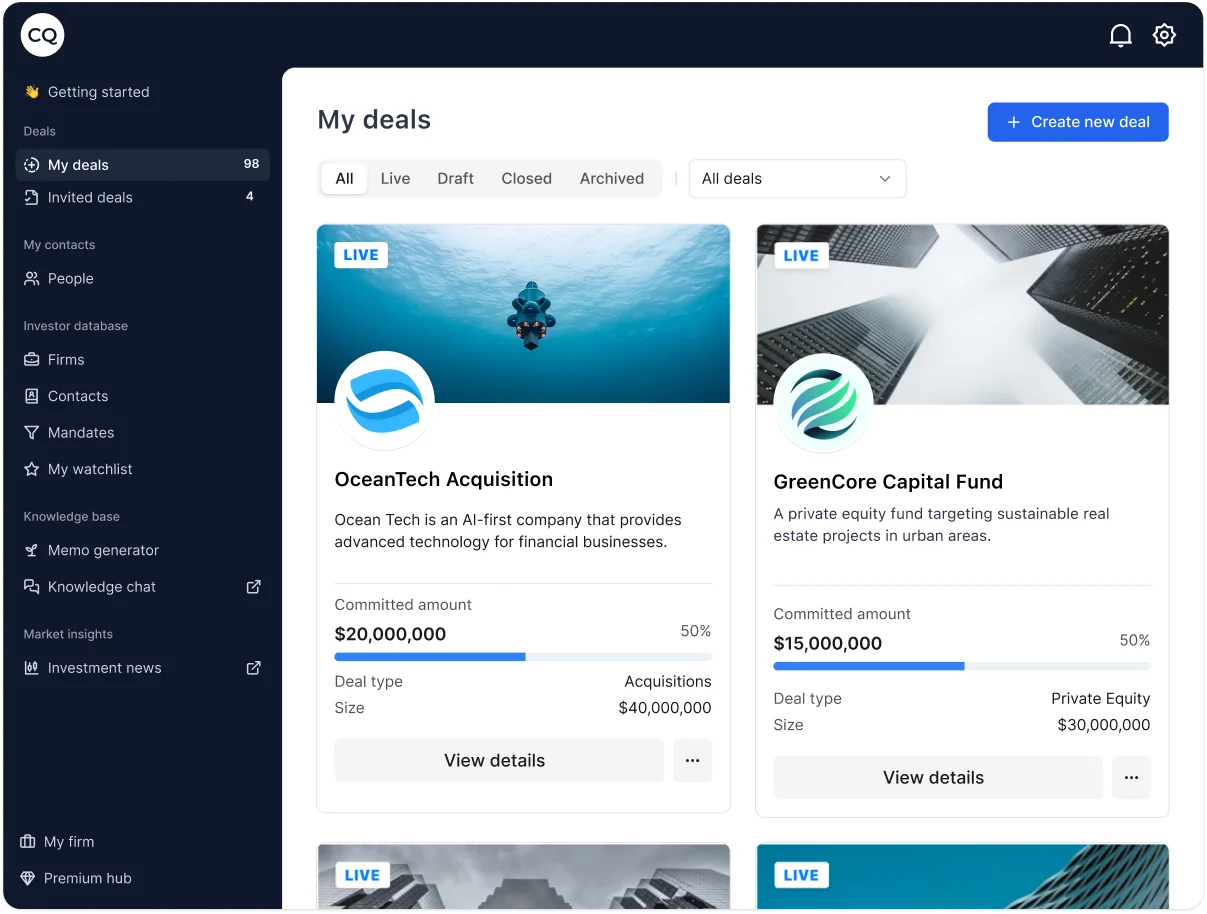
Close with full visibility
NDAs sign themselves. LPs explore your deal in a clean portal. Track every commitment from soft-circle to signed.
- Zero NDA chasing
- LP portal
- 2x faster closes
We use CQ for our own raises
Built by an asset manager. Battle-tested on real fundraises.
Invested
by our team
Deals
closed by our team
LP Profiles
in database
Ready to close your fund faster?
Start free. See LP matches in minutes. No credit card required.